Last week, I assembled the first prototype of the load cell system. It was able to read the force applied to the sensor and send the data to Arduino serial terminal. However, it's still a bit inconvenient to process the data like plotting or doing mathematic operations in the serial terminal. With PLX-DAQ, we can send the real-time data collected by Arduino into Excel, where it's much easier to process data.
Note: this post referenced this instructable tutorial.
First, download the PLX-DAQ software here and install it;
Arduino Part
In the setup function in the arduino sketch, include these codes:
Serial.begin(9600);
Serial.println("CLEARDATA");
Serial.println("LABEL,Acolumn,Bcolumn,...");
Serial.println("RESETTIMER");
These are control directives for the PLX-DAQ. CLEARDATA clears the previous data in the column, LABEL directive specifies the name of the columns and RESETTIMER resets the internal timer.
In the loop() function, first include this control directive:
Serial.print("DATA,TIME,TIMER,");
DATA specifies that the rest of the serial output will be labeled as data and recorded in the column. First two parameters are TIME which specifies the current time and TIMER which records the elapsed time since it starts.
After that, just simply print out the values that needed to be printed. Don't forget to start a newline and include a delay in the end:
Serial.println();
delay(100);
Excel Part
Open up PLX-DAQ spreadsheet; click OK on the dialogue box. Then this will show up:
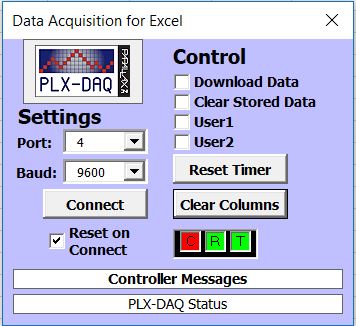
Choose the correct port in Arduino and the correct baud, click on "connect", and the data should be showing up in the excel file. (Don't forget to upload the Arduino code)
Reading example:
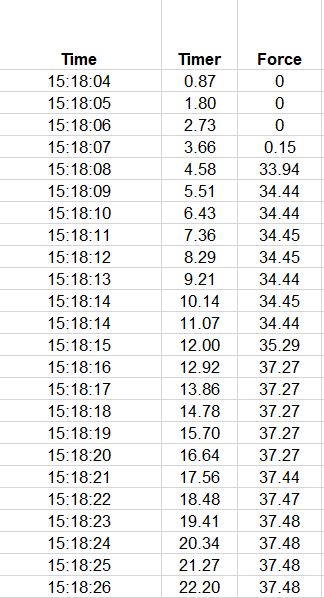
There are three tabs in the excel file, they are simple data, simple data with plots, and interactive bar graph. The script will execute on the first tab position; move tabs accordingly to cater different needs.
ANY OTHER QUESTIONS PLEASE REFER TO THE HELP FILE OR INSTRUCTABLE TUTORIAL