22
Jul
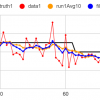
Last week, I worked on filtering three independent data streams from barometers using a simple Kalman filter. The output is given below: The black lines represent the ground truth, the red dots represent each data point, the orange curve represents the output of a running average filter with 1...
- «
- »