Last week, I worked on filtering three independent data streams from barometers using a simple Kalman filter. The output is given below:
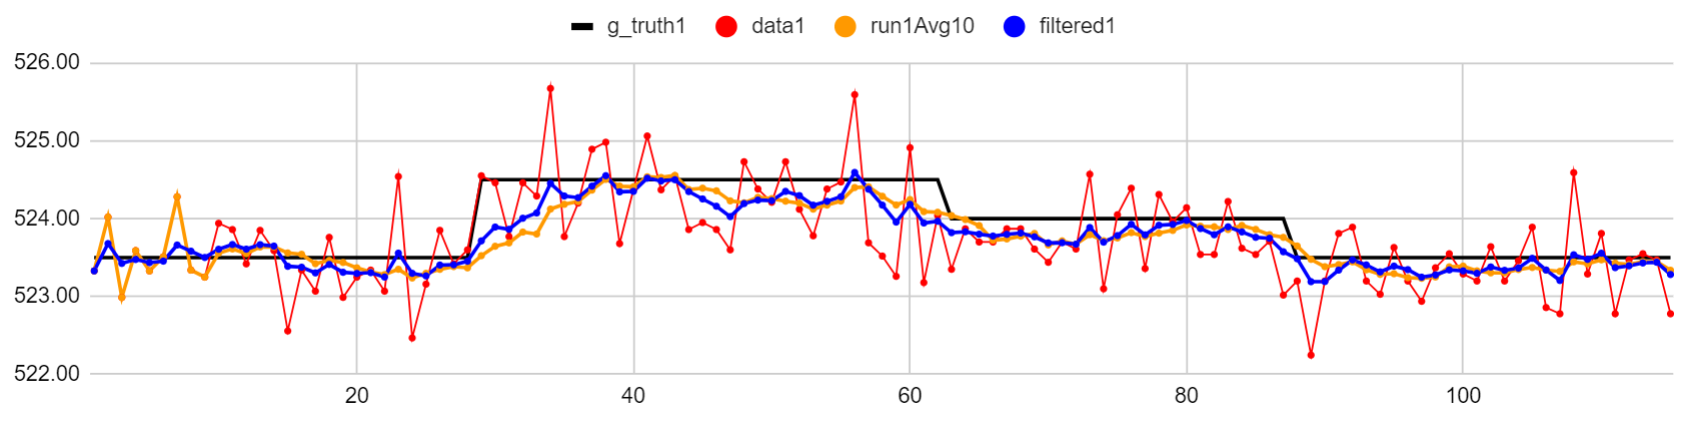
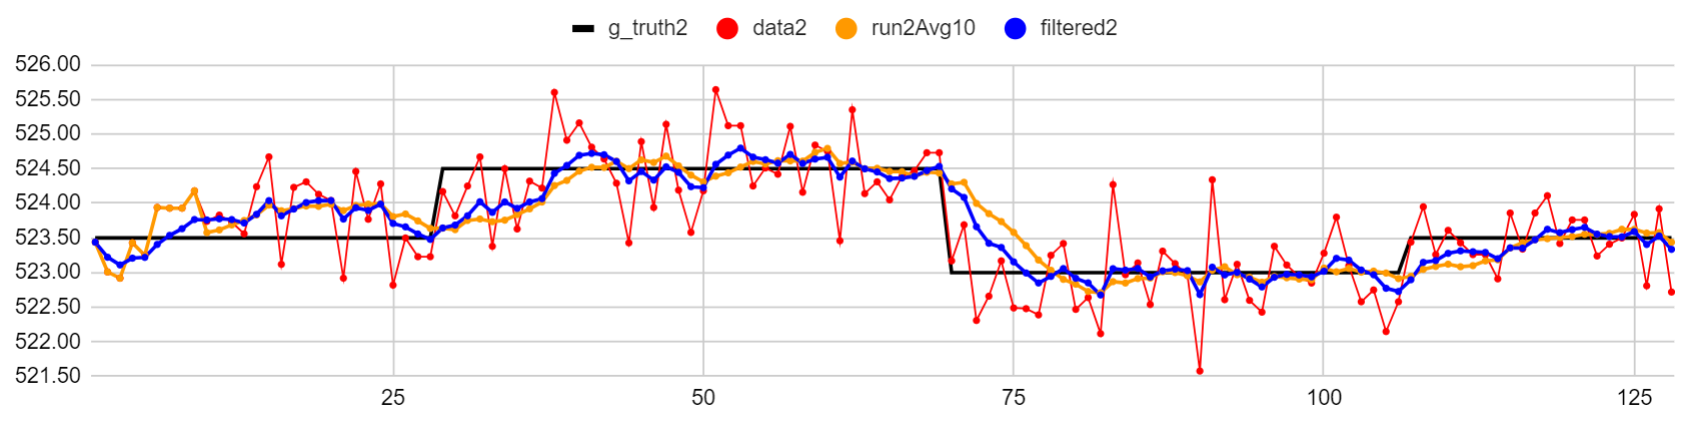
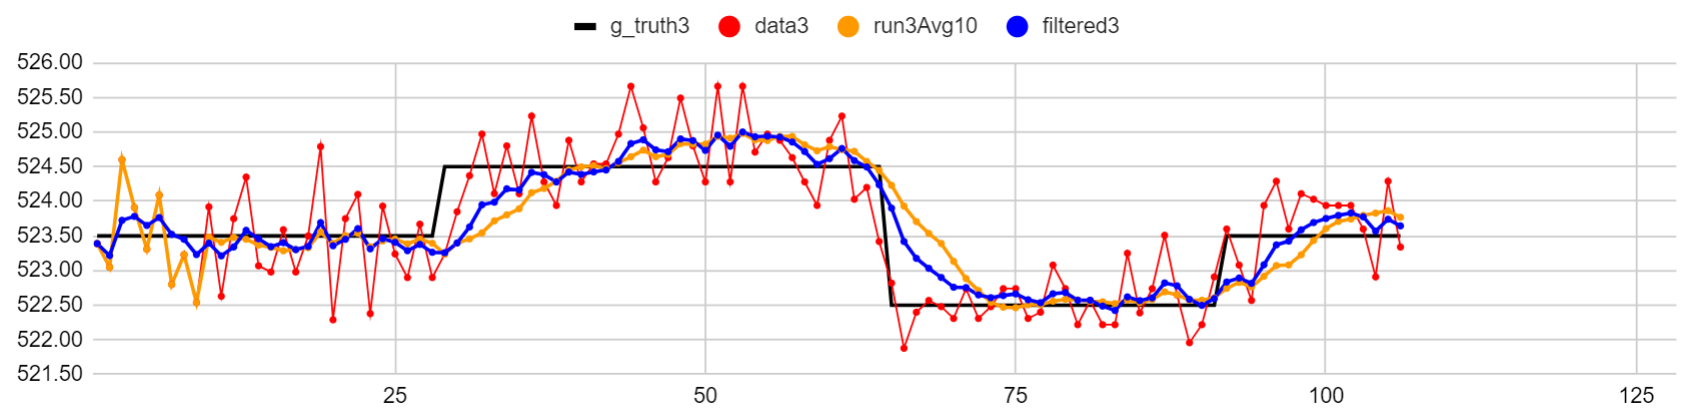
The black lines represent the ground truth, the red dots represent each data point, the orange curve represents the output of a running average filter with 10 data points, and the blue curve represents the output of the Kalman filter. The Kalman filter does almost as good as the running average filter in remaining at the same value while it sustains a sharp change in value faster than the latter.
The main code is available in this repo and the Kalman filter has been adopted from this repo.