While progress on implementing the machine learning for the controller continues, I thought I would an update on the new FOM (figures of merit) for the autonomous controllers, which are used to evaluate the ability of the autonomous controller to reduce traffic. The new figures are the result of several days of computing time on the Hoffman2 cluster and are calculated from over 100,000 simulations in varying traffic conditions.
Each figure of merit is a number in the interval \([0, 1]\) with \(0\) being the worst performance, and \(1\) being the best possible performance. For these calculations we evaluate the performance of the controller using two criteria, the ability to attenuate oscillations, and the ability to improve throughput. The two FOM are defined as
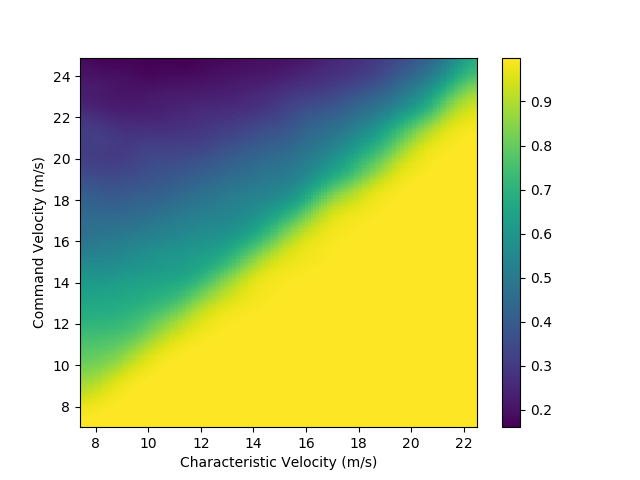
\[ \text{FOM}_{\text{osc}} = \lim_{T\to\infty} \frac{\sup_{t\geq T} v(t) - \inf_{t\geq T}v(t)} {v_\text{max}}\]
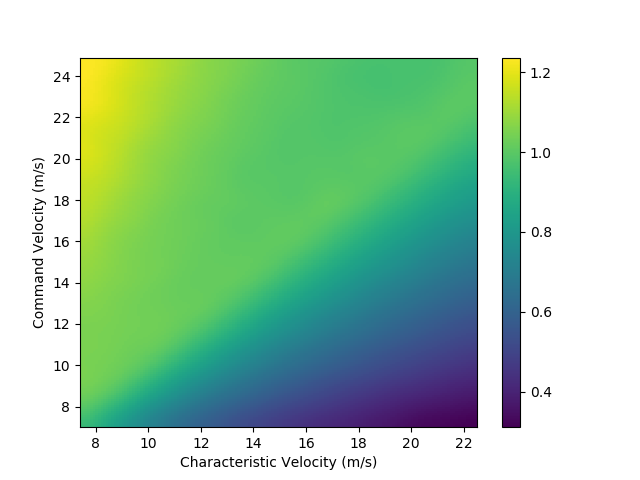
\[ \text{FOM}_{\text{throughput}} = \frac{v_\text{mean}}{v_\text{characteristic}}\]
where above \(v_\text{mean}\) is the mean velocity at steady state and \(v_\text{characteristic}\) is the characteristic velocity of the traffic system. Given some \(\gamma\in[0,1]\) quantifying the relative preference of measuring performance with respect to oscillation or throughput, we define the FOM as
\[ \text{FOM} = \gamma \text{FOM}_{\text{osc}} + (1 - \gamma)\text{FOM}_{\text{throughput}}\]
Above is the plot for \(\text{FOM}_{\text{osc}}\):
and the plot for \(\text{FOM}_{\text{throughput}}\):
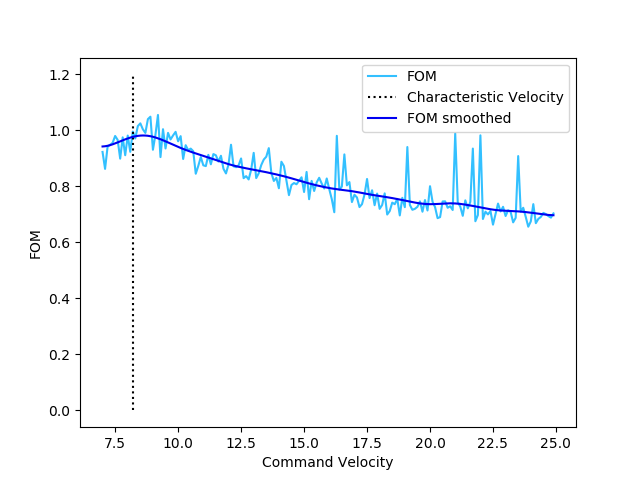
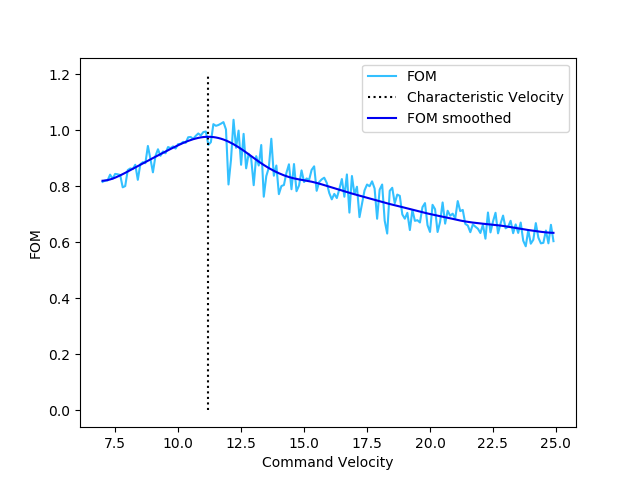
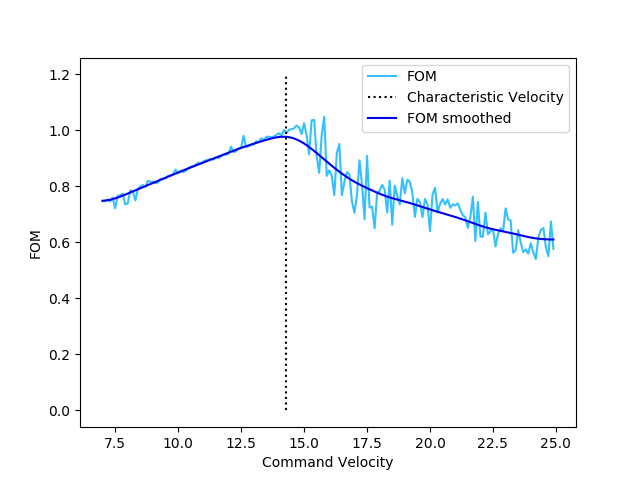
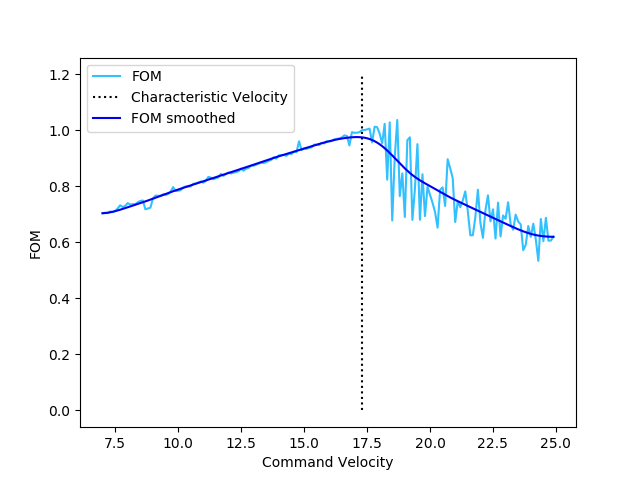
Finally, we plot the FOM for \(\gamma=0.5\):
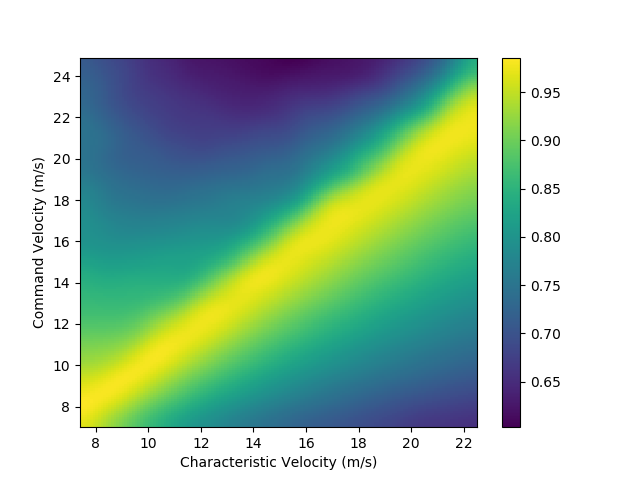
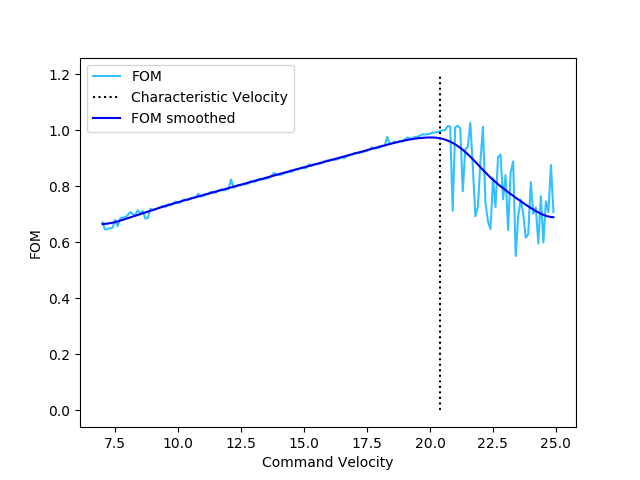
As expected, optimal performance occurs in a narrow band containig the graph of \(U = v_\text{characteristic}\). Indeed, this may be seen by looking at slices of the FOM at various fixed values for \(v_\text{characteristic}\):