The below figures show the ground truth (gt, black), a noisy dead reckoning signal (dr, red), and an NLS optimization using the noisy dr as a seed, and IMU data to constrain relative motion.
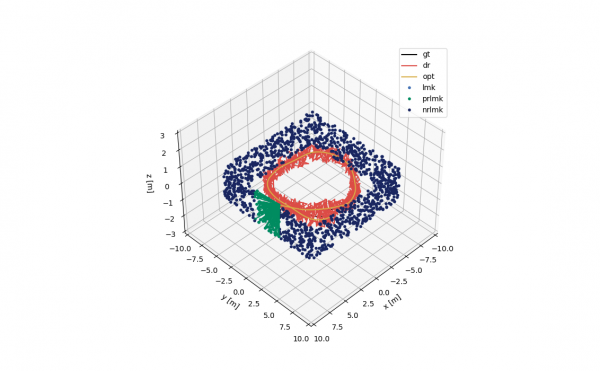
The above figure shows all trajectories, and landmarks (lmk, navy) and feature points (plmk, green).
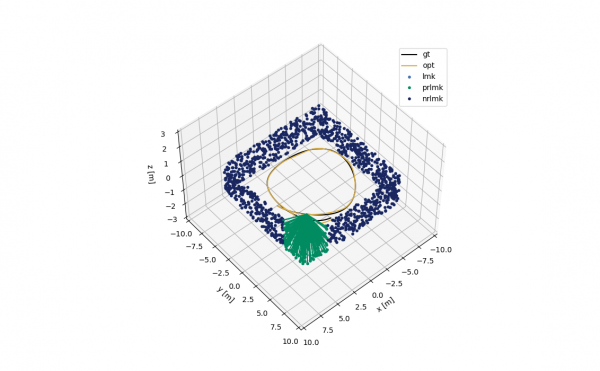
The above figure shows the robot facing a corner, with dr removed.
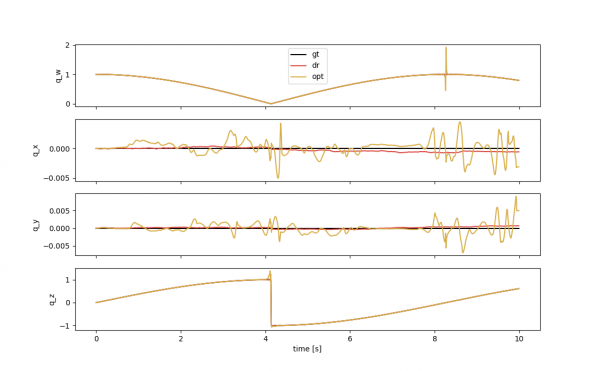
The above figure shows rotation for all signals.
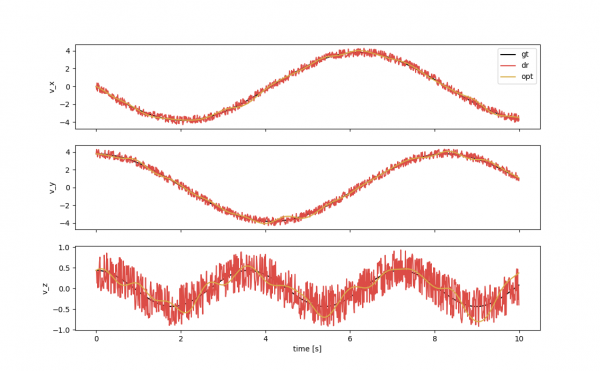
The above figure shows velocity for all signals.
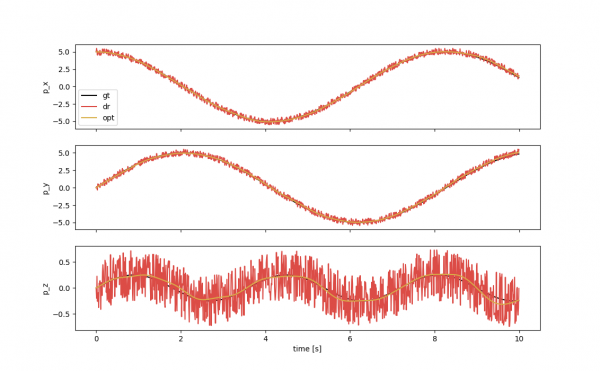
The above figure shows position for all signals.
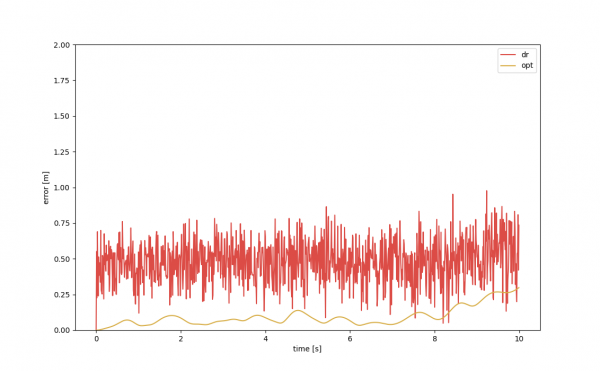
The above figure shows position error for all signals.
TODO:
-
Create containers housing observation information, i.e. landmark id, and feature posititions u, v.
-
Set up using ceres optimization syntax, such that landmarks are another decision variable and observations are constraints. Once completed, the NLS SLAM simulation is complete.