FORAY - Regression-based Distance Detection
Aaron John Sabu foray machine learning regressionOver the last few days, I took some time formatting and labelling the newly obtained images of the ball at different distances from the camera. Following this, I passed the bounding box information through a regression model to detect the relation between the size of the bounding box (relative to the size of the image) and the distance of the ball from the camera. The plot below represents this relation where the x (or y) axis represents the corresponding ratio of the width (or height) of the bounding box to the width (or height) of the image and the z axis represents the distance from the camera to the ball.
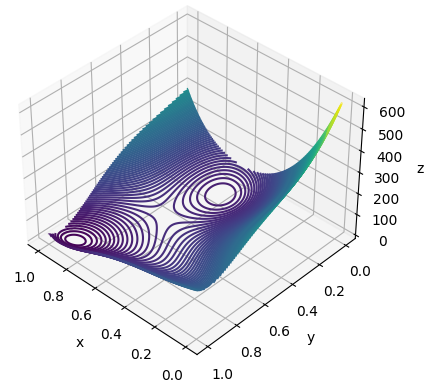
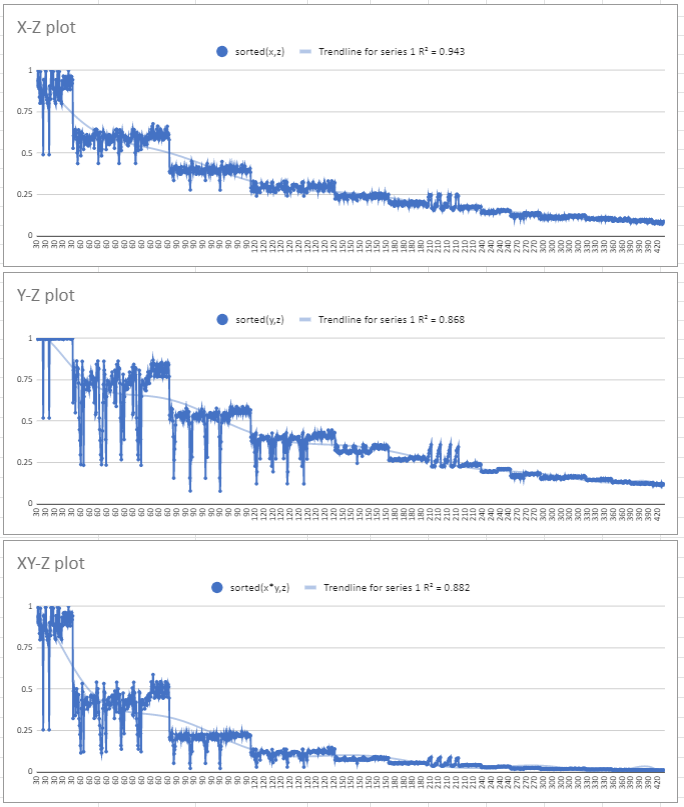
There is a small sink close to (0.4,0.2) which is unusual considering the trend of the plot. This occurs due to the variation in the size of the bounding box for the same value of distance. This problem may cause a local shift in the detected value of distance. The following plot of the raw data depicts this variation.
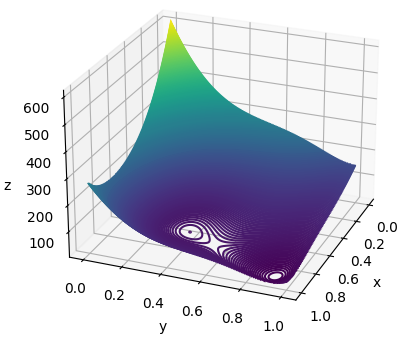
In order to fix this issue, I trained the model using images whose bounding box values lie within a 2*std-dev range around the mean of each set of values. This gives a much better outcome with the previously observed sink almost completely removed:
The code for the above regression model is available here and the stored weights are available as JSON files in the same directory as the code.